


CPT - Sand (Suryasentana, Lehane, 2014)
This p-y curve is derived from cone penetration test (CPT) results and is suitable for sands. Its shape is shown in Figure 1.
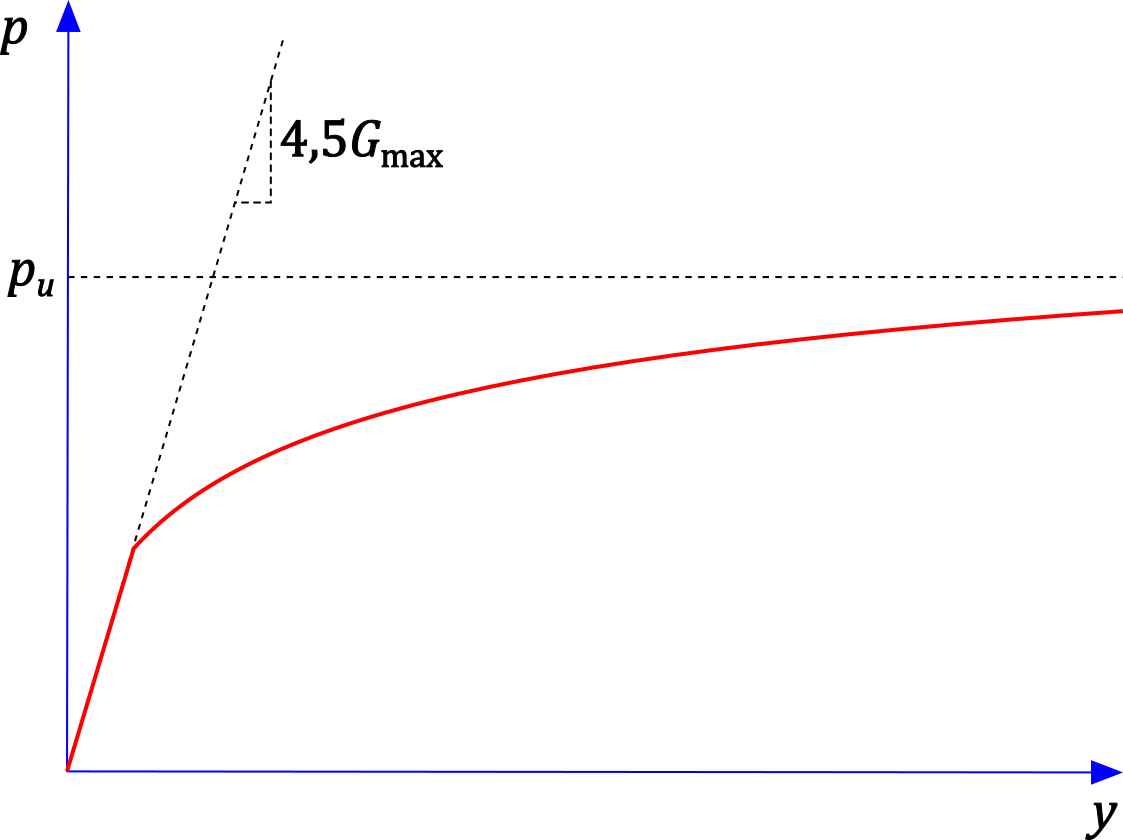 Figure 1: p-y curve CPT - Sand (Suryasentana, Lehane, 2014)
The input parameters for determining the curve are:
d [m] | – | pile diameter |
z [m] | – | depth below the ground surface |
γ [kN/m3] | – | unit weight of the soil |
qc [MPa] | – | cone resistance from the cone penetration test |
The ultimate soil resistance pu is calculated as follows:

where σeff is the effective stress in the soil at the given point.
The parameter that defines the initial linear part of the curve is the small-strain shear modulus Gmax. According to [2], its value in kPa is given by the empirical relationship:

The linear part of the p-y curve is then described by the function:

The nonlinear part of the curve has an exponential form and is described by the function:

where ηw is the saturation factor given by:
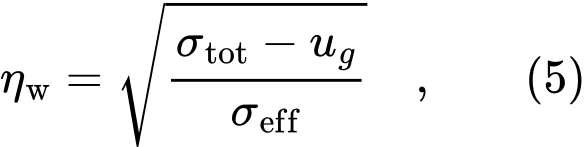
where σtot is the total stress in the soil at the given point, σeff is the effective stress in the soil at the given point, and ug is the water pressure at the ground surface.
The boundary between the linear and exponential parts of the curve is the intersection of functions (3) and (4). The program does not determine this intersection exactly; instead, the curve is always formed by the smaller of the values given by (3) and (4) for the given displacement y.
References:
[1] Suryasentana S. K., Lehane B. M. : Updated CPT-based p–y formulation for laterally loaded piles in cohesionless soil under static loading, In: Géotechnique, 66(6), pp. 445–453, 2016
[2] Rix G. J., Stokoe K. H. : Correlation of Initial Tangent Modulus and Cone Penetration Resistance, In: Proceedings of the 1st International Symposium on Calibration Chamber Testing (pp. 351–362), Potsdam, New York