


Silt (Reese, 1974)
The p-y curve used for silt is based on the curve for sands both above and below the water table and is shown in Figure 1.
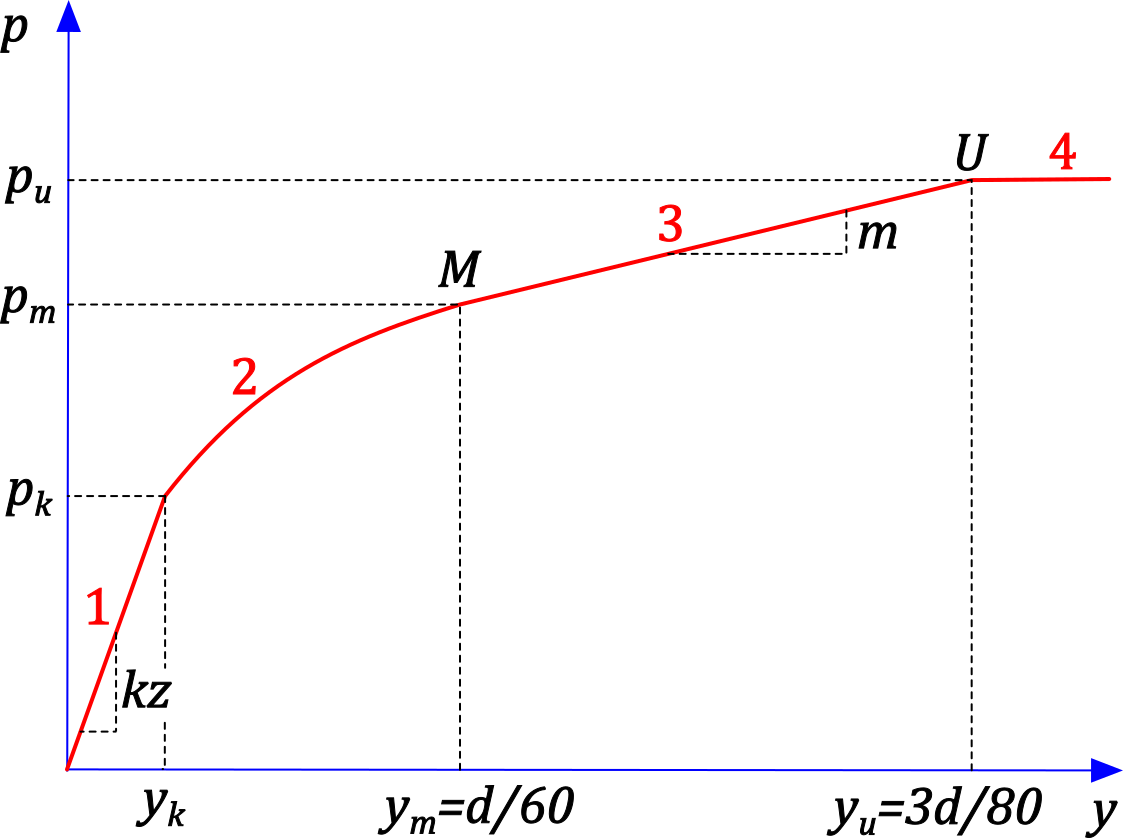 Figure 1: p-y curve for silt (Reese, 1974)
The input parameters for determining the curve are:
d [m] | – | pile diameter |
z [m] | – | depth below the ground surface |
γ [kN/m3] | – | unit weight of the soil |
φef | – | effective angle of internal friction of the soil |
cef [kPa] | – | effective cohesion of the soil |
k [MN/m3] | – | initial soil stiffness |
J | – | empirical factor (typically 0.5) |
The curve consists of four parts:
1. Linear part defined by the initial soil stiffness
2. Parabolic part
3. Linear part defined by curve points M and U
4. Constant part after the ultimate soil resistance pu has been reached
First, points M = [ym; pm] and U = [yu; pu], which govern the shape of the curve, are determined.
The values ym and yu are fixed: ym = d/60 and yu = 3d/80. The value pu is the ultimate soil resistance. To calculate pu and pm, the friction and cohesion components are determined first.
The friction component pφ is taken as the smaller of the values pφst and pφd:


where

The cohesion component pc is taken as the smaller of the values pcs and pcd:


The values pu and pm are calculated as follows:

where the coefficient A is determined from the chart in Figure 2, with separate values for static and cyclic loading.
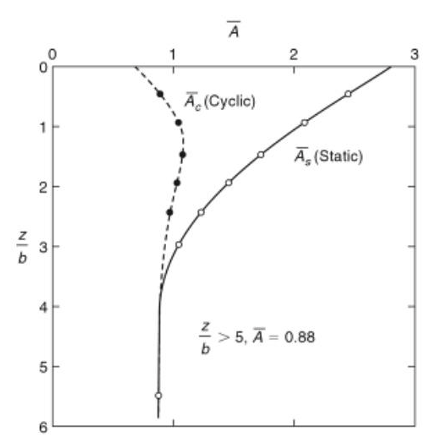 Figure 2
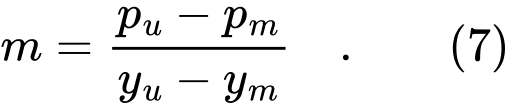
From points M and U determined in this way, the slope of part 3 of the curve is calculated:
Part 2 of the curve (parabolic) is described by:

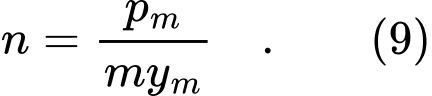
where the parameters C and n are determined so that the parabolic part connects smoothly to part 3 (linear) of the curve. From the continuity of the first derivative, the parameter n is given by:
The parameter C follows from the continuity of the curve at point M:
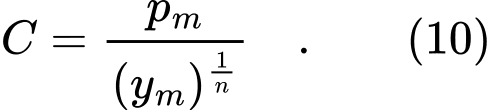
The overall shape of the curve is further influenced by the slope of linear part 1, which is defined by the initial soil stiffness k. Figure 3 shows that linear part 1 can intersect the parabola or other parts of the p-y curve. If it intersects the parabola, the curve consists of four parts, as shown in Figure 1. If it intersects the linear part between points M and U, the parabolic part is absent and the curve consists of only three linear parts. If linear part 1 intersects the constant part beyond point U, the p-y curve is only bilinear.
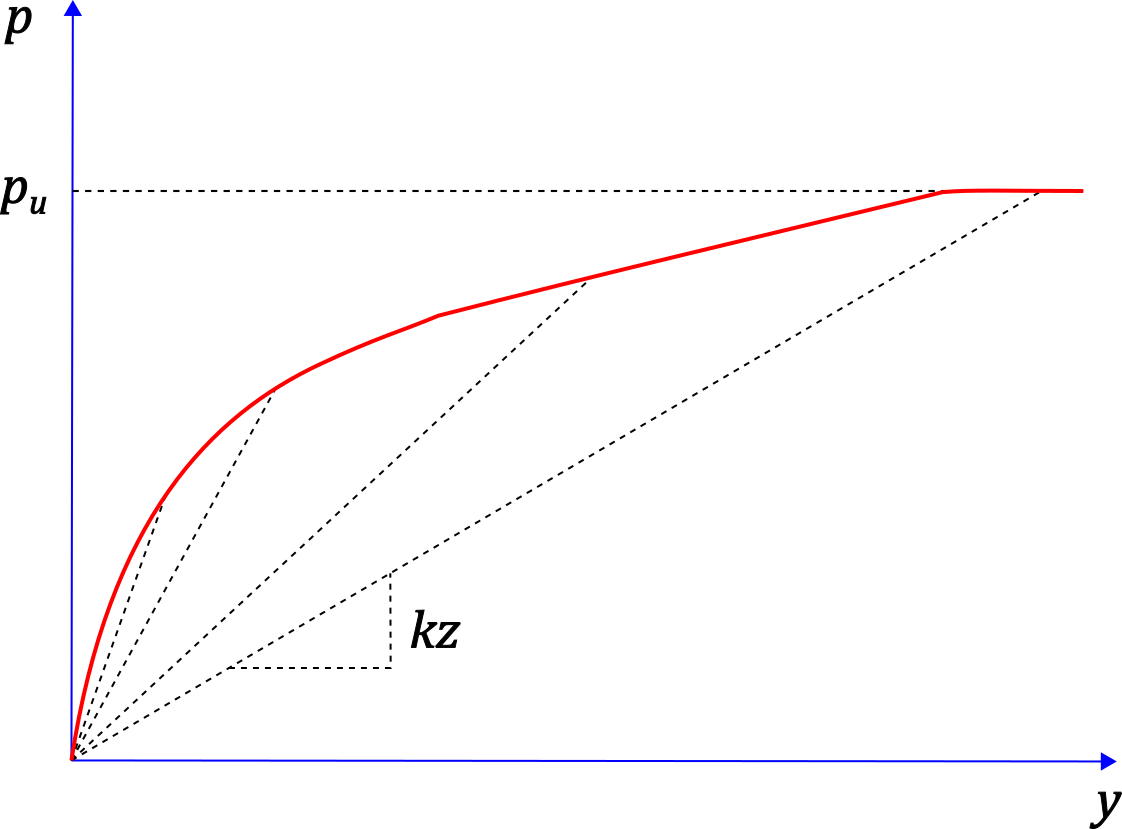 Figure 3: Influence of the initial stiffness k on the overall shape of the p-y curve
In cohesive soils (unlike cohesionless soils), the value of pm calculated from equation (6) may be higher than pu. This is unacceptable because it results in a negative slope m from equation (7) and a negative exponent 1/n in equation (8). In this case, the exponent is taken as 1, and the parabolic part of the curve becomes linear with the slope C0.
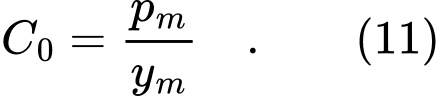
The p-y curve is then bilinear. Until pu is reached, the smaller of the values is used

beyond that point, the p-y curve has a constant value of pu.